Confidence Interval and t-Test for Analytical Chemistry Data
You titrate the same sample five times and get five slightly different volumes. Which one is “right”? None of them alone. The honest report is the mean with a confidence interval, which says how far the true value could plausibly lie from your mean. For small samples (n usually 3 to 10 in a laboratory), the interval uses Student’s t, not the normal-curve value of 1.96. This is core material for analytical chemistry papers and for any practical report.

The formulas
Standard error = s / √n
Confidence interval: x̄ ± t · s / √n
t-test against a known value μ: tcalc = |x̄ − μ| · √n / s
- x̄ = sample mean; s = sample standard deviation (with n − 1 in the denominator).
- n = number of repeat measurements; degrees of freedom = n − 1.
- t = critical value from a t-table for your confidence level (95% is common) and degrees of freedom. Use the table printed in your book or in the exam paper. For reference, the two-tailed 95% value is 2.776 for 4 degrees of freedom and 2.571 for 5 degrees of freedom.
How to read the result
A 95% confidence interval means: if you repeated the whole experiment many times and built an interval each time, about 95% of those intervals would contain the true mean. It does not say there is a 95% probability that this one interval contains it, and it does not describe the spread of single readings. For the t-test, if tcalc is larger than the table t, the difference between your mean and the known value is statistically significant at that confidence level.
Worked examples
Example 1: mean, standard deviation and 95% interval. Five titre readings (mL): 24.85, 24.90, 24.80, 24.95, 24.85.
Mean: (24.85 + 24.90 + 24.80 + 24.95 + 24.85) / 5 = 124.35 / 5 = 24.87 mL.
Deviations: −0.02, +0.03, −0.07, +0.08, −0.02. Squares: 0.0004, 0.0009, 0.0049, 0.0064, 0.0004; sum = 0.0130.
s = √(0.0130 / 4) = √0.00325 = 0.0570 mL.
Standard error = 0.0570 / √5 = 0.0570 / 2.2361 = 0.02550 mL.
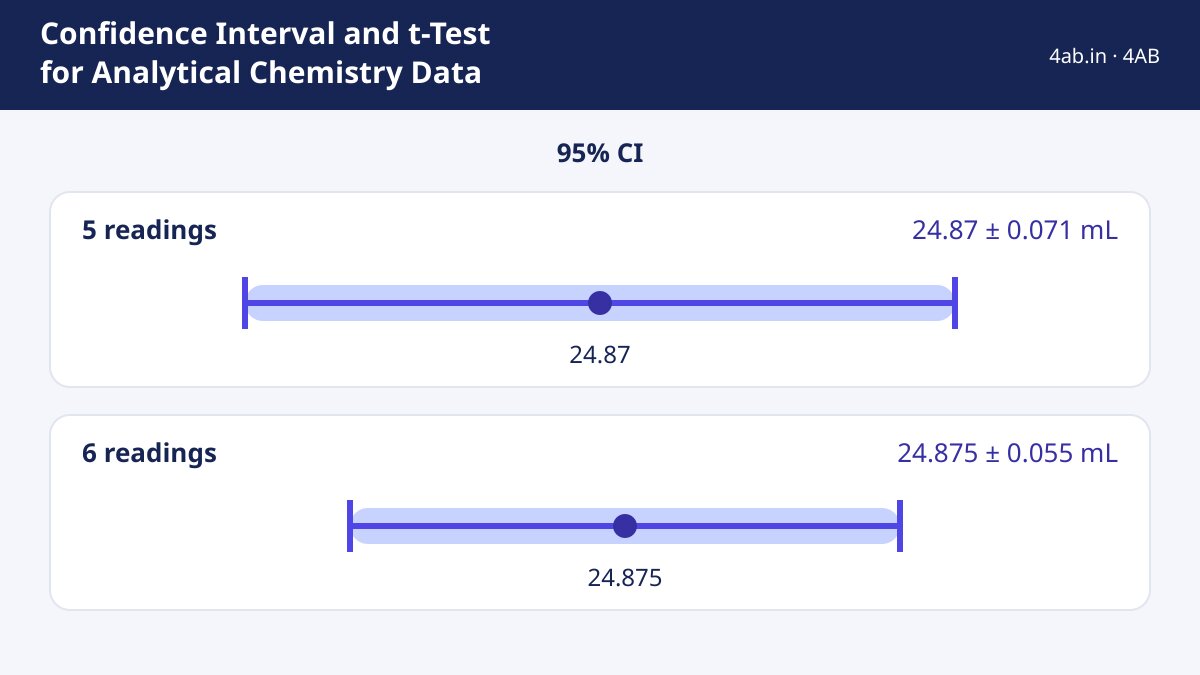
95% CI = 24.87 ± 2.776 × 0.02550 = 24.87 ± 0.0708 = 24.87 ± 0.07 mL, i.e. 24.80 to 24.94 mL.
Example 2: relative standard deviation. Using the same data: RSD = (s / x̄) × 100 = (0.0570 / 24.87) × 100 = 0.23%. This tells you the precision of the technique (repeatability), not its accuracy.
Example 3: t-test against an expected value. The expected titre for the standard sample is 24.80 mL. Does your mean differ significantly?
tcalc = |24.87 − 24.80| × √5 / 0.0570 = 0.07 × 2.2361 / 0.0570 = 2.75.
Table value at 95%, 4 degrees of freedom = 2.776. Since 2.75 < 2.776, the difference is not significant at the 95% level. Note that it is very close to the limit; a sixth reading would sharpen the picture. Consistency check: 24.80 lies just inside the interval 24.80 to 24.94 from Example 1.
Example 4: how an extra measurement changes the interval. Add a sixth reading of 24.90 mL. New mean = 149.25 / 6 = 24.875 mL; new s = 0.0524 mL. With 5 degrees of freedom, t = 2.571, so CI = 24.875 ± 2.571 × 0.0524 / √6 = 24.875 ± 0.055 mL.
The interval has narrowed from ±0.071 to ±0.055 mL. More repeat measurements give a tighter interval, but the improvement slows down because it depends on √n.
Common mistakes
- Dividing by n instead of n − 1 when calculating s from a small sample.
- Using 1.96 (normal curve) for five readings. With so few data points, 1.96 gives an interval that is too narrow and over-confident.
- Reading the t-table with n instead of n − 1 degrees of freedom.
- Confusing the standard deviation s (spread of readings) with the standard error s/√n (uncertainty of the mean).
- Reporting too many decimals. The interval’s size decides the sensible last digit.
- Treating a non-significant result as proof that the two values are identical. It only says the data cannot show a difference.
Exam-relevance table
| Task | Formula |
|---|---|
| Spread of readings | s with n − 1 |
| Uncertainty of the mean | s / √n |
| Interval for the true value | x̄ ± t s / √n |
| Compare mean with a reference | tcalc = |x̄ − μ| √n / s, compare with table t |
Exams that expect this will usually print the t-table. Check the latest official syllabus and papers for what applies to you.
Enter your repeat readings to get the mean and standard deviation, then apply t and √n yourself.
Open the Statistics Calculator →Step-by-step maths tools for algebra, calculus, matrices and statistics.
More Concepts articles