Serial Dilution and Calibration Curves: From Stock to Unknown
Almost every quantitative measurement in an analytical or biochemical laboratory starts with a dilution. A stock solution is too concentrated to measure, so it is diluted in steps, and the readings of the diluted samples are converted back to the original. The arithmetic is only M1V1 = M2V2 repeated, but exam questions, and real laboratory records, go wrong in the bookkeeping. This article covers serial dilution and its main use, the calibration curve. It stays at the level of method and principle; it does not rely on any particular published study.

The ideas and formulas
Dilution factor, DF = Vfinal ÷ Valiquot = Cstart ÷ Cend
Serial dilution: DFtotal = DF1 × DF2 × … × DFn
Calibration line: A = m c + b → cdiluted = (A − b) ÷ m, coriginal = cdiluted × DF
C is concentration in any one unit (mol L−1, mg L−1 or ppm for dilute water solutions) and V is volume in any one unit. Valiquot is the volume of solution you transfer, and Vfinal is the total volume after adding diluent, not the volume of diluent alone. A “1:10 dilution” in most laboratory writing means 1 part sample in 10 parts total (DF = 10). Some texts write “1:9” for 1 part sample plus 9 parts diluent. Both mean the same solution; always write the dilution factor, not just the ratio, in your working.
In a serial dilution each tube is made from the previous one, not from the stock. That is the reason the factors multiply. It also means any pipetting error in an early tube carries through to every later tube.
Worked example 1: a 10-fold series
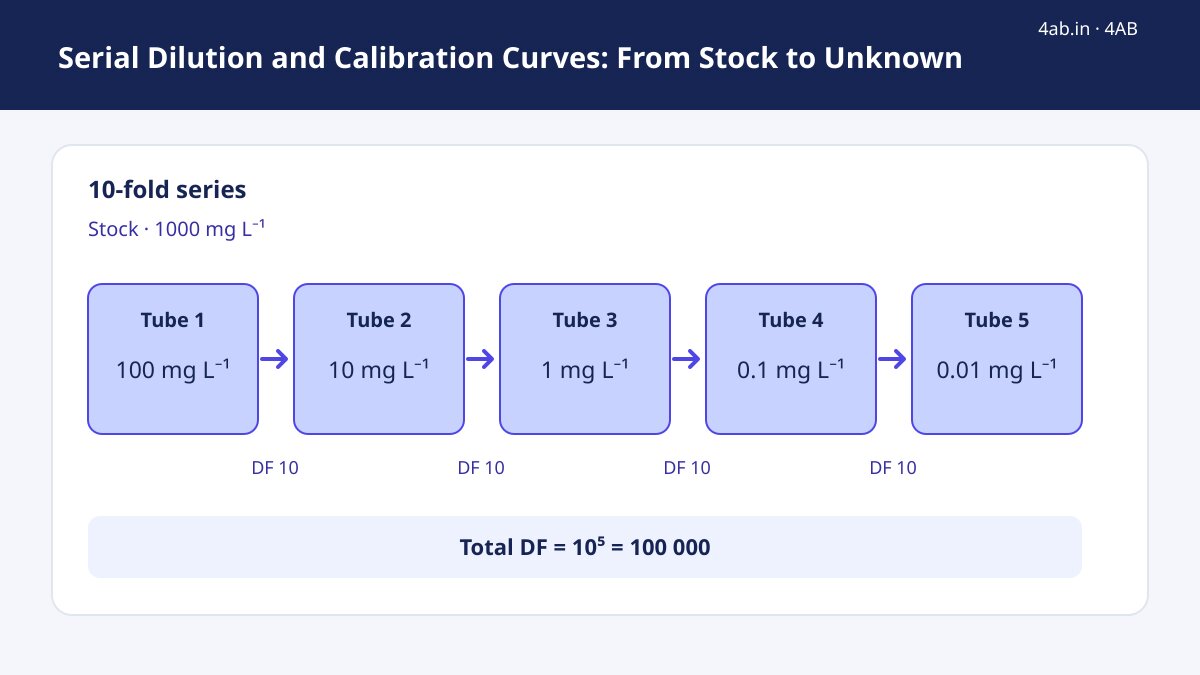
Question. Stock = 1000 mg L−1. Transfer 1.00 mL into 9.00 mL of diluent, mix, and repeat from each new tube to make five tubes. Find each concentration and the total dilution factor.
Each step: Vfinal = 1.00 + 9.00 = 10.00 mL, so DF = 10.00 ÷ 1.00 = 10.
Tube 1: 1000 ÷ 10 = 100 mg L−1
Tube 2: 10 mg L−1
Tube 3: 1 mg L−1
Tube 4: 0.1 mg L−1
Tube 5: 0.01 mg L−1
Total DF for tube 5 = 105 = 100 000. Check: 1000 ÷ 100 000 = 0.01. Correct.
Worked example 2: a two-fold series
Question. Start with 800 units mL−1. At each step mix equal volumes of the previous tube and diluent (for example 1.00 mL + 1.00 mL). Give the first six concentrations.
Each step has DF = 2.00 ÷ 1.00 = 2. Concentrations: 400, 200, 100, 50, 25, 12.5.
The total DF after 6 tubes is 26 = 64, and 800 ÷ 64 = 12.5. Two-fold series are useful when you need many points between two limits, because the concentrations change slowly from tube to tube.
Worked example 3: preparing a standard from stock
Question. Prepare 250.0 mL of a 5.0 mg L−1 standard from a 1000 mg L−1 stock.
V1 = C2V2 ÷ C1 = (5.0 × 250.0) ÷ 1000 = 1.25 mL.
That volume is small, and a small pipette error is a large share of 1.25 mL. A better plan is two steps. First make an intermediate of 100 mg L−1 (10.0 mL of stock diluted to 100.0 mL). Then V1 = (5.0 × 250.0) ÷ 100 = 12.5 mL of the intermediate, diluted to 250.0 mL. The total DF is the same (1000/5 = 200 = 10 × 20), but each transfer is a more measurable volume.
Worked example 4: reading an unknown from a calibration curve
Practice data. Six standards were measured at one wavelength after zeroing with the blank:
| c (mg L−1) | 0 | 2 | 4 | 6 | 8 | 10 |
|---|---|---|---|---|---|---|
| A | 0.002 | 0.121 | 0.238 | 0.362 | 0.479 | 0.601 |
Least-squares line. Mean c = 5.00, mean A = 0.3005. Sxx = Σ(c − 5)2 = 70.0. Sxy = Σ(c − 5)(A − 0.3005) = 4.193. Slope m = 4.193 ÷ 70.0 = 0.0599 per mg L−1. Intercept b = 0.3005 − 0.0599 × 5.00 = 0.0010. The fit has R2 = 0.9999.
Unknown. A sample was diluted by taking 1.00 mL and making it up to 25.00 mL (DF = 25.00). Its absorbance was 0.315, which lies inside the range of the standards (0.002 to 0.601).
cdiluted = (0.315 − 0.0010) ÷ 0.0599 = 5.242 mg L−1.
coriginal = 5.242 × 25.00 = 131.05, so about 131 mg L−1.
Check: predicted A at 5.242 mg L−1 = 0.0599 × 5.242 + 0.0010 = 0.3150. Correct. (These numbers are made-up practice data, not a real measurement.)
Common mistakes
- Using the diluent volume instead of the final volume in the dilution factor. 1 mL in 9 mL of diluent is DF = 10, not 9.
- Forgetting to multiply back by the dilution factor after reading the concentration from the curve. The curve gives the concentration in the measured solution, not in the original sample.
- Adding dilution factors in a series. They multiply.
- Extrapolating the line. A reading above the highest standard may lie outside the linear range. Dilute the sample further and measure again.
- Ignoring the blank. Standards must be corrected for the blank, or the intercept will be wrong.
- Treating each tube as made from stock when it is made from the previous tube, so the error accumulates.
- Mixing units such as mg L−1 and µg mL−1 (these two are numerically equal, but mol L−1 is not).
Why a straight line, and when it fails
The calibration line is usually based on the Beer–Lambert law, A = εlc, which predicts absorbance proportional to concentration at a fixed path length. This holds over a limited range. At high concentration, interactions between solute molecules, stray light in the instrument and chemical equilibria such as dimerisation can bend the line. The correct response is to stay inside the range that your standards cover, never to stretch the line beyond it.
Exam relevance
| Question type | What to do |
|---|---|
| Concentration after n serial steps | Divide the stock by the product of the dilution factors |
| Volume of stock for a standard | V1 = C2V2 ÷ C1; use an intermediate if V1 is tiny |
| Unknown from calibration data | Fit A = mc + b, solve for c, multiply by DF |
| Why standards should bracket the sample | The line is valid only inside the measured range |
| Why is the blank subtracted? | Removes reagent and cuvette absorbance from the signal |
Details such as the number of standards or acceptable R2 depend on the method and the question; check the instructions given in your paper or the official syllabus.
Use the dilution tool to check each single-step volume in Examples 1 and 3 before you plan the series.
Open the Dilution Calculator (M₁V₁ = M₂V₂) →Turn this concept into marks: solve previous-year CSIR-NET questions and take a timed quiz.
More Solutions articles