The discovery, explained · Chemist no. 255 of 350
Lothar Meyer and the Atomic Volume Curve: Seeing Periodicity in a Graph
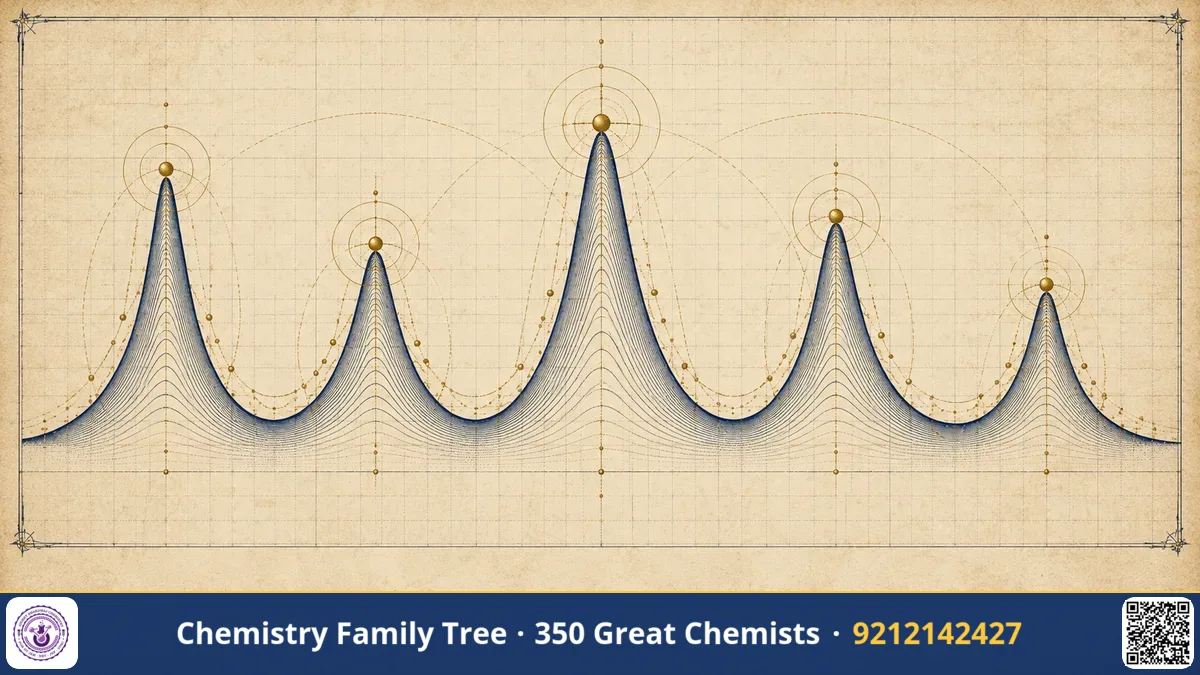
Every chemistry student remembers the periodic table as Mendeleev's creation. But in the same years, a German chemist named Julius Lothar Meyer reached very similar conclusions by a different road. He did not start with a list of properties. He plotted a graph. The graph of atomic volume against atomic weight rose and fell like a wave, and each peak was an alkali metal. In one picture, Meyer showed that the physical properties of elements repeat in a regular way. In this post we explain what he did, why it mattered, and how this simple idea still appears in your exam questions on periodic trends.
The Scientific Problem Before the Discovery
By the 1850s chemists knew more than 60 elements, but there was no agreed order. Atomic weights were confused, because different chemists used different formulae for the same compound. Some took water as HO, others as H₂O. This confusion was cleared at the Karlsruhe Congress of 1860, where Stanislao Cannizzaro explained how Avogadro's hypothesis could give reliable atomic weights. Lothar Meyer attended and later said that reading Cannizzaro's pamphlet felt as if the scales fell from his eyes.
With correct atomic weights available, the question became: is there a pattern? Earlier workers such as Döbereiner (triads) and Newlands (octaves) had noticed partial relationships. Nobody had a complete, convincing system.
The Discovery: From Valence Table to Atomic Volume Curve
In 1864 Meyer published the book Die modernen Theorien der Chemie ("Modern Theories of Chemistry"). It contained a table of 28 elements arranged in order of increasing atomic weight and grouped by valence. The table left gaps and was an early step towards the full periodic system. Later, in 1868, he prepared a more extended table, but it was published only after his death. His famous graph came in 1870, in a paper in Annalen der Chemie.
The steps of his method are easy to follow:
- Arrange the elements in order of increasing atomic weight.
- For each element calculate the atomic volume, defined as atomic weight divided by density of the solid element.
- Plot atomic volume on the y-axis and atomic weight on the x-axis.
- Join the points.
Atomic volume = Atomic weight / Density
Example (sodium): 23 g/mol / 0.97 g/cm³ ≈ 24 cm³/mol
Example (carbon, diamond): 12 / 3.5 ≈ 3.4 cm³/mol
The curve that appeared had a striking shape. The alkali metals Li, Na, K, Rb and Cs sat at the peaks. The elements between them fell into the valleys and rose again. Similar elements occupied similar positions on the rising or falling parts of the curve. Properties such as melting point, boiling point, hardness and compressibility also showed periodic behaviour when plotted this way.
| Element | Approx. atomic volume (cm³/mol) |
|---|---|
| Lithium | 13 |
| Sodium | 24 |
| Potassium | 45 |
| Rubidium | 56 |
| Caesium | 70 |
The values show that atomic volume rises sharply at each alkali metal. These numbers are approximate, but they let you see why the peaks appear.
The Chemistry Behind It
Why does the curve behave like this? We now explain it with electronic structure, which Meyer did not know.
- Across a period, nuclear charge increases while electrons enter the same shell. Effective nuclear charge (Zeff) rises, pulling the electrons closer, and the atoms become denser and smaller. Volume falls.
- At the start of a new period, a new electron shell begins. The single outer s electron is far from the nucleus and well shielded. The atom becomes large and the volume jumps up. That is the alkali metal peak.
- Down a group, extra shells are added, so atomic volume increases from Li to Cs.
Meyer's curve also shows that the elements in the middle of each long period (transition metals) have low atomic volumes, because d-electrons add metallic bonding strength and the metals are dense. Another detail: the curve becomes broader in the long periods, which is the visible reason why periods 4 and 5 contain 18 elements and not 8.
Meyer's graph and Mendeleev's table complement each other. Mendeleev stressed chemical properties and bold predictions about undiscovered elements like eka-aluminium (gallium) and eka-silicon (germanium). Meyer stressed physical properties and the smooth graphical picture. In 1882 the Royal Society of London awarded the Davy Medal jointly to both men for the discovery of the periodic relations of the atomic weights. Meyer was more cautious than Mendeleev. He did not use his table to change accepted atomic weights or to predict new elements with details, and that is one reason Mendeleev is remembered first.
Applications Today
- Teaching periodic trends: The atomic volume curve is still drawn in textbooks to show periodicity of atomic radius, density and melting point.
- Materials science: Trends in molar volume help in predicting alloy formation and density of new metals and alloys. In India, metallurgists use density and packing data of metals in designing alloys for aerospace and defence.
- Battery chemistry: The large size of Na and K compared with Li is a key factor in the design of sodium-ion batteries, a topic of current research at Indian institutes.
- Inorganic reasoning: Knowing that alkali metals have the largest atomic volumes explains their low density, softness and easy loss of the outer electron.
Exam Corner
- Meyer's graph plotted atomic volume against atomic weight, and the peaks are occupied by alkali metals.
- Atomic volume = atomic weight / density. Units: cm³/mol.
- Meyer and Mendeleev shared the Davy Medal in 1882.
- Meyer's 1864 book contained a table of 28 elements arranged by valence.
- Which period shows sudden rise in atomic volume? The start of each new period, due to addition of a new shell.
Common Misconceptions
- "Meyer copied Mendeleev." Both worked independently. Meyer's fuller 1870 paper came after Mendeleev's 1869 table, but his 1864 table already showed periodic grouping.
- "Atomic volume is the same as atomic radius." No. Atomic volume is molar volume of the solid (cm³/mol), which includes packing and the number of atoms, while atomic radius is the size of a single atom.
- "The peaks are noble gases." Noble gases were not discovered then. The peaks are alkali metals.
Quick Revision Box
- Lothar Meyer (1830-1895), German chemist.
- Plotted atomic volume vs atomic weight; periodic wave with alkali metal peaks.
- 1864: Modern Theories of Chemistry with a valence-based table of 28 elements.
- 1870: atomic volume curve paper in Annalen.
- Atomic volume = atomic weight / density.
- 1882: Davy Medal shared with Mendeleev.
FAQ
Who discovered the periodic table, Meyer or Mendeleev?
Both contributed. Mendeleev published his table in 1869 and made detailed predictions. Meyer independently produced similar tables and the famous atomic volume curve in 1870. Mendeleev gets the main credit because of his predictions.
What does the atomic volume curve show?
It shows that atomic volume varies periodically with atomic weight, with the highest values for alkali metals.
Why is the volume of potassium greater than that of sodium?
Potassium has an extra electron shell, so its outer electron is farther from the nucleus. The atom occupies more space.
Is Meyer's work asked in competitive exams?
Yes, usually as a matching or one-line fact: his name is linked with the atomic volume curve and the periodic law, along with Mendeleev and Newlands.
Published by ABC Chemistry — IIT-JAM | CSIR-NET | GATE Chemistry Coaching. Visit abcchemistry.com
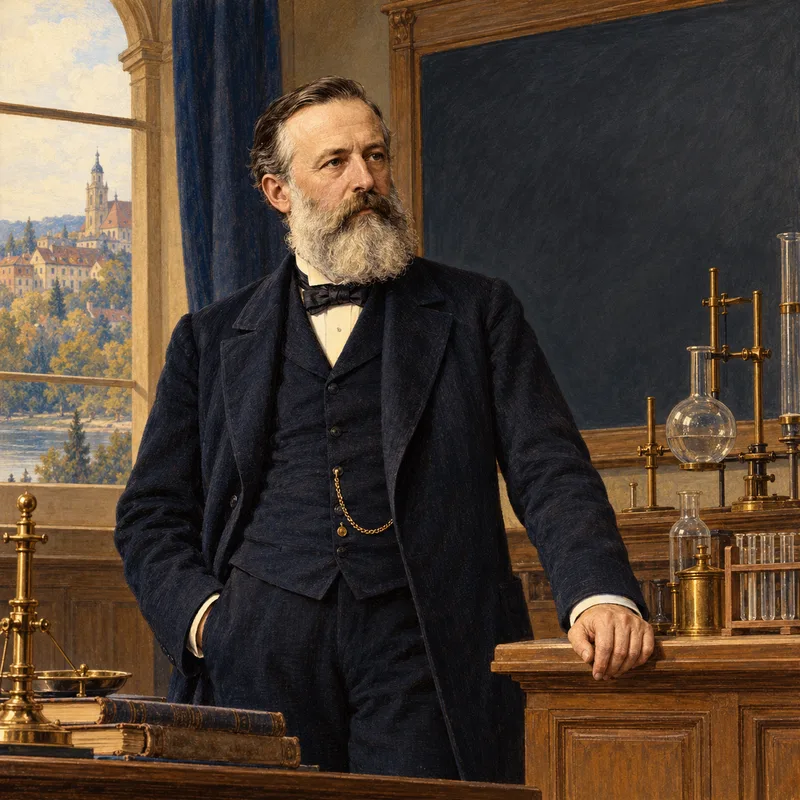
About the chemist
Lothar Meyer
1830-1895 · Germany
Periodic table; valence arrangement of elements