ABC26PH0205 · Statistical Thermodynamics
Subject: Physical Chemistry · Chapter: Statistical Thermodynamics · Topic: Statistical Thermodynamics – General · Exam: CSIR-NET DEC 2014 · Marks: 2 · Difficulty: Medium
Identify the speed distribution functions of Ne, Ar and Kr with the curves in the figure above: 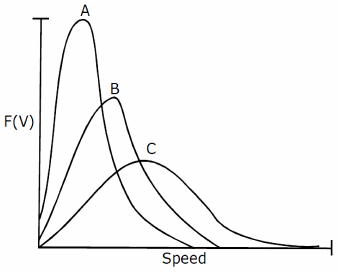
(a)Ne-A ,Ar-B, Kr-C
(b)Ne-B ,Ar-C, Kr-A
(c)Ne-C ,Ar-B, Kr-A
(d)Ne-C ,Ar-A, Kr-B
Answer
Answer (as printed): C
Explanation
Maxima in the curve corresponds to the most probable speed of the gas. As $M_{Ne}<M_{Ar}<M_{Kr}$, so $C_{(M.P)Ne}<C_{(M.P)Ar}<C_{(M.P)Kr}$. So, curve C corresponds to Ne, B to Ar and A to Kr.