The plot that describes a Carnot cycle is: · ABC26PH0572
Subject: Physical Chemistry · Chapter: Thermodynamics · Topic: Thermodynamics – General · Exam: GATE 2005-2021 · Marks: 2 · Difficulty: Easy
The plot that describes a Carnot cycle is:
(a)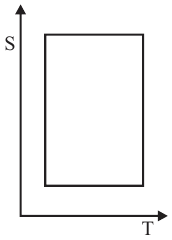
(b)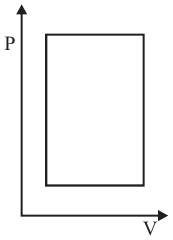
(c)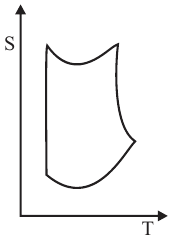
(d)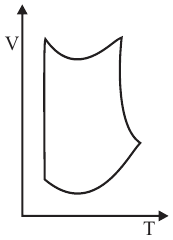
Answer
Answer: A ✓ checked by 4AB · confidence high
The source book printed no answer; this one was worked out and checked — see the explanation.
Explanation
A Carnot cycle is two isotherms (constant T) and two reversible adiabats (constant S), which form a rectangle on an S–T plot (a).
Study loop for Thermodynamics